

USD as the pivot, why EM equities (7.61%) and EM debt (about 6%) move together
10 year nominal returns in USD, unhedged, from Alpha Research based on 60 CMA reports: EM Equities 7.61% (N=74), EMD Hard 5.98% (N=63), EMD Local 6.09% (N=29).


This week’s question
Markets love a clean story, even when reality is messy. Emerging Markets rarely get one narrative that covers both equities and debt at the same time. Yet the Alpha Research CMA dataset, built from 60 long term reports, produces three unusually usable anchors. The uncomfortable question is simple: when the crowd converges, is that clarity, or complacency?
4 pillars, 3 assets, 1 regime: the USD and financial conditions do the heavy lifting
The common thread is straightforward: when the USD stabilises or weakens and financial conditions ease, EM assets often benefit together, across both risk and spread markets. That is why EM equities and EM debt can look attractive at the same time in long term assumptions. The twist sits in dispersion: EM debt forecasts cluster tightly around 6%, while EM equities show a much wider range across quintiles. In plain English, the crowd feels more confident about debt than about equity, even if both lean on the same macro regime.
At a glance
Return definition: nominal, USD, unhedged, 10 year CMAs
Source: Alpha Research, based on 60 CMA reports
Equity index: MSCI Emerging Markets
EMD hard index: Bloomberg Emerging Markets United States Dollar Aggregate USD
EMD local index: Bloomberg Emerging Markets Local Currency Government USD
Key hinge: USD direction, financial conditions, risk appetite
3 tables, 166 observations, and the shape of the crowd
Emerging Market Equities, quintiles (N=74)
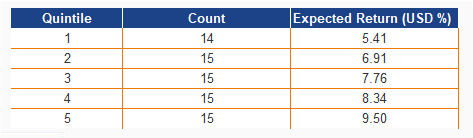
Read-through: your 7.61% consensus sits close to the middle (Q3 7.76%, median 7.80%). The range is still wide, the crowd agrees on the centre, not on the path.
EMD Hard Currency, quintiles (N=63)
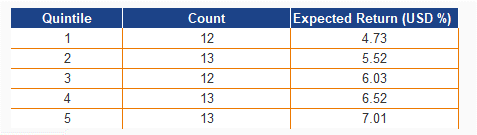
Read-through: this distribution is noticeably tighter than equities. The middle (median 6.00%, Q3 6.03%) supports your 5.98% consensus as a clean working proxy.
EMD Local Currency, quintiles (N=29)
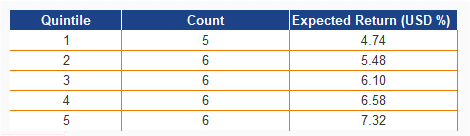
Consensus: 6.09% (USD)
Median: 6.25%
Q3: 6.10%
Read-through: local screens slightly higher than hard on both consensus and median. The “why” likely sits in FX assumptions, but your “keep it simple” approach is sensible for now.
The key takeaway for asset allocators
One sentence: the regime logic is shared, but confidence is not. EM debt looks like a tighter call than EM equities in the CMA crowd. That does not make debt safe, it makes forecast dispersion smaller, which is a different kind of comfort.
Emerging Market Equities
6 tailwinds, 1 shared driver, why EM equities keep resurfacing in CMAs
The bull case is valuation plus regime. Several houses highlight attractive EM valuations (Standard Chartered, Pictet). The bigger lever is macro: a stable or weaker USD is repeatedly framed as a tailwind (BNY, Fidelity, RBC), especially when paired with easier financial and monetary conditions that support risk appetite (AllianzGI, PineBridge). Add the growth angle, earnings breadth and growth outside the US, including EM (AllianzGI, UBS). Then the structural layer: reforms and productivity gains via AI and automation (Federated). Put together, EM equities look less like a single bet and more like a basket that works when the USD and global liquidity stop tightening.
4 frictions, 1 knife twist, why valuation rarely saves you
China and tech weakness can drag the EM label (Northern Trust AM). Political, FX, and regulatory risks can dominate fundamentals, and volatility remains structurally higher (Franklin Templeton, Nuveen risk framing). Trade tensions and tariff headlines remain a persistent uncertainty (PineBridge, RBC). There is also model driven caution, with downgrade signals in parts of the EM complex (PineBridge). The twist is that almost every pro argument flips if the USD strengthens and the regime turns risk-off.
Emerging Markets Debt
5 supports, 0 drama, why EMD keeps looking like a “6% asset”
The pro case is clear: carry. Multiple managers point to relatively high and attractive yields (Nuveen, T. Rowe Price, UBP). A weaker USD is again a meaningful tailwind (Franklin Templeton, UBP). Some link support to disinflation and improving fundamentals (Franklin Templeton, Pictet). Others emphasise that spreads can stay supported, or tighten further, if fundamentals and flows cooperate (J.P. Morgan, PineBridge, Morgan Stanley). Implementation matters: there is preference for specific segments, such as hard currency and IG sovereigns (Morgan Stanley, UOB AM). Your distribution reinforces the story, the centre clusters around 6%.
2 cautions, 1 practical reality, why neutral can be the right stance
You did not find explicit underweight calls within the allowed EMD terms, which itself signals how “consensus-friendly” this sleeve is right now. The main counterpoint is not bearishness, it is lack of conviction, a neutral, balance-position framing for EM USD debt (BNY). The practical reality is that EMD is not one thing, segment choice matters, and your index definitions underline that (USD aggregate versus local government). In a risk-off shock, spreads and FX can still hurt, even if long-run carry screens attractive.
What this means for an asset allocator
Use these figures as anchors, not promises. If your base case is stable-to-weaker USD and easing financial conditions, EM can be one coherent long-term allocation story across both equity and debt. Size it differently: EMD reads like the tighter forecast with a clearer carry logic, while EM equities are the higher-dispersion expression of the same regime. In a “less is more” framework: start with EM debt for carry discipline, add EM equity when you explicitly want pro-cyclical upside.
Debate this in the comments
A) Make EM Debt your core EM exposure (carry first, equity optional)
B) Go equity-led (valuation plus earnings breadth, debt as a satellite)
One sentence: which sleeve best matches your base case for USD and risk appetite over the next 6 to 12 months?