

Two reports, the same direction, one credit market that still has to choose
72 asset managers meet what they do. 284 buy-side strategists reveal what they think. The gap is in credit — and it is measurable.


The asset allocation consensus for March 2026 barely moves. Just 51 view adjustments, down from 69 the month before. The only meaningful change: Corporate Bonds shifts from underweight to neutral. Otherwise: stillness.
That stillness is a good moment to hold the Consensus up against the ASR Asset Allocation Survey from February 2026, “Asset Allocators More Constructive: due to stronger, longer growth and benign monetary policy.” Two sources, different architecture. The Alpha Research Consensus aggregates the monthly TAA reports of 72 asset managers worldwide, from Amundi to Wellington, measuring each asset class on a scale from -1.00 to +1.00.
The ASR survey captures direct opinions from 284 CIOs and strategists at institutional investors, collectively responsible for $13.4 trillion in assets under management. To make both sources comparable on a single scale, the ASR implied probabilities have been transformed using the Alpha Research Consensus method: (Very Likely + Likely) minus (Unlikely + Very Unlikely), divided by 100. The result runs from -1.00 to +1.00, identical to the Consensus scale. The transformation is my own analytical step, the comparison is not a reproduction of ASR output.
The table below shows where they agree and where they diverge.
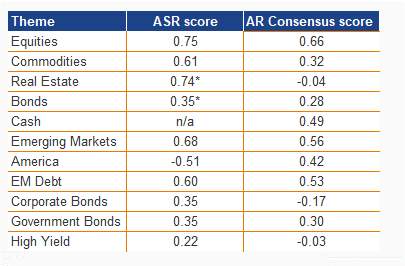
*ASR score based on Real Assets beat Treasuries and Treasuries beat Cash respectively. Scale runs from -1.00 to +1.00: above +0.20 overweight, below -0.20 underweight, in between neutral.
Where both sources agree
The areas of agreement are strong and broadly supported. Equities scores +0.75 at ASR against +0.655 in the Consensus: both sources point unambiguously to a risk-on baseline. Emerging Markets stands at +0.68 at ASR and +0.561 in the Consensus, the highest regional score on both sides. Commodities confirms the same directional signal: +0.61 versus +0.324. The arguments overlap: a weaker dollar, attractive valuations, stronger world trade.
Where the scores diverge
The first significant difference sits with America. ASR strategists score US outperformance versus non-US at -0.51: a pronounced negative conviction. The Consensus has America at +0.422, down from first to third place but still overweight. The direction is the same, the intensity differs sharply. Buy-side strategists are considerably more negative on the US than the TAA reports of asset managers suggest. The implication is direct: if buy-side conviction at -0.51 proves correct, current allocator positioning at +0.422 has further to fall.
The sharpest break sits in credit. ASR scores Corporate Bonds at +0.35 and Government Bonds at +0.35. The Consensus stands at -0.167 and -0.298 respectively. Those are opposing positions on the same scale. Buy-side strategists are constructive on investment grade credit and government bonds as carry instruments. TAA allocators are not. This is not a difference in tone. It is a measurable difference in position.
What the table does not show
What the table cannot show deserves a separate note. The ASR survey measures not only what professionals prefer, but also what they actively exclude. Recession risk scores -0.77. Higher Fed Funds -0.76. A stronger dollar -0.60. These are the strongest positions in the entire survey, and they sit at the bottom. The Consensus has no equivalent: TAA reports measure positive direction, not the active rejection of the bear case. Placing both sources side by side produces a fundamentally more complete picture of where professional capital is positioned and where it is deliberately not. For anyone building a macro view, that is the more valuable half of the information.
Conclusion
The Consensus measures what asset managers do. The ASR survey measures what strategists think. On equities and Emerging Markets the two track closely: scores of +0.75 versus +0.655 on equities, +0.68 versus +0.561 on EM. In credit they diverge, measurably and concretely. Corporate Bonds at +0.35 at ASR, -0.167 in the Consensus. Government Bonds at +0.35 at ASR, -0.298 in the Consensus. Two sources, the same scale, opposing positions. Strategists treating bonds as a carry instrument, allocators staying underweight: consistently inconsistent, until the market decides.
Two reports, the same direction. One credit market that still has to choose.
New to this? The asset allocation consensus aggregates the monthly recommendations of dozens of major asset managers worldwide to show where professional sentiment stands. Add a direct buy-side survey alongside it, and you see not only where the market is moving, but also what professionals are deliberately betting against.