

The Consensus Was Right. The Map Was Wrong.
The commodity overweight was built on PMI data and Chinese growth. Then the Strait of Hormuz closed. Same position, different world.


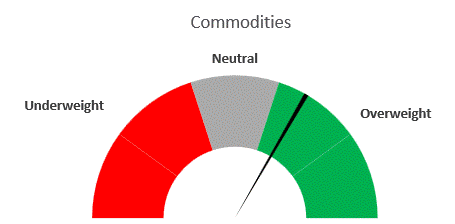
41.2% overweight, 50.0% neutral, 8.8% underweight. The plurality was in the overweight column, and the thesis beneath it just broke.
Seventy-two reports. Commodities rank second in the investment consensus, directly behind equities. Sentiment has been more positive than this only 14.4% of the time since 2012. That consensus was built on an accelerating global economy: February 2026 PMI data showed the strongest global growth since May 2024, the best manufacturing figures since December 2021, and China growing at its fastest pace since May 2023.
Then the Strait of Hormuz closed.
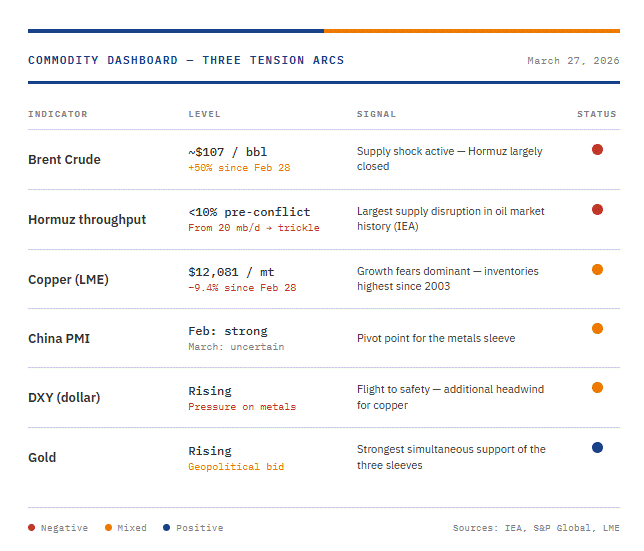
Since February 28, 2026, the macro foundation beneath that consensus no longer exists. The Strait carried roughly 20 million barrels per day in 2025, approximately one fifth of global oil consumption and over a quarter of worldwide seaborne oil trade. That flow has now fallen to less than 10% of pre-conflict levels. Brent peaked at $126 on March 8 and was still trading around $107 on March 21, more than 50% above its pre-war level. The IEA described this as the largest supply disruption in the history of the global oil market. Gulf states have collectively curtailed more than 10 million barrels per day. This is not a geopolitical risk premium at the margin. This is a structural supply shock.
Three tension arcs, not two
Until Hormuz closed, the commodity story ran on two axes: dollar direction and Chinese growth momentum. A third arc has now emerged that overshadows both, for as long as the strait remains closed.
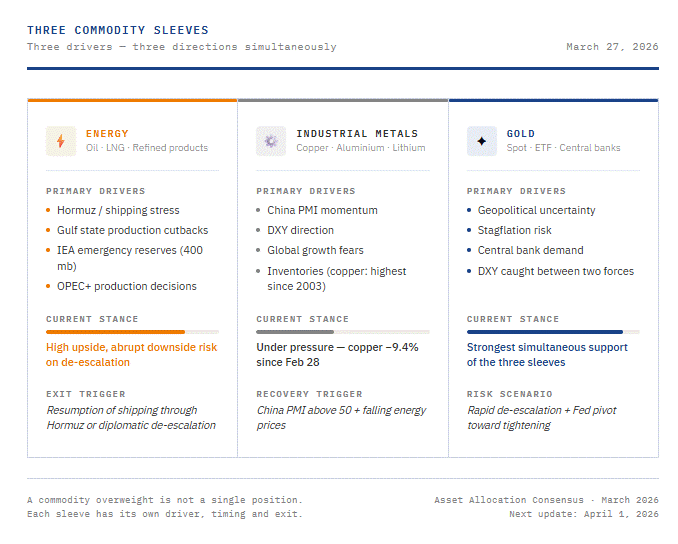
The first arc is Hormuz and shipping stress. This extends well beyond crude. Global LNG supply has fallen roughly 20% due to Gulf disruptions, with Qatar as the largest casualty. More than 30% of global urea trade and around 20% of ammonia trade normally transits the Strait. Maersk and Hapag-Lloyd have suspended their Middle East routes. The IEA launched the largest emergency reserve release in its history: 400 million barrels. A significant buffer, not a structural solution.
The second arc is the dollar. A rising DXY while oil prices climb creates an unusual regime: the dollar no longer brakes commodity prices, it signals flight to safety while supply-driven upward pressure runs independently. A weakening dollar from here becomes an additional tailwind on top of Hormuz.
The third arc is China PMI. Higher oil prices and disrupted supply chains weigh on industrial activity globally, and that pressure is now visible in the data. Copper fell 9.4% since the outbreak of the conflict, to $12,081 per metric ton on March 23. Global inventories surpassed one million metric tons for the first time since 2003. The strongest growth figures in years offered no protection once growth fears took over.
Two scenarios for energy
The bull case is straightforward: the supply shock persists, Brent stays structurally above $100, and gold moves in tandem as a geopolitical and stagflation hedge. Goldman Sachs projects an average Brent of $110 through Q2, with a worst-case of $135 if the Strait remains closed through June.
The bear case is de-escalation. A diplomatic opening or partial reopening quickly removes the risk premium from oil. At that point, DXY and China PMI reclaim dominance, and the story shifts back to structural metals and gold.
Three sleeves, three drivers
The commodity overweight is now a basket of conflicting micro-regimes. Three explicit sleeves are required.
The energy sleeve is driven by Hormuz, shipping stress, inventories, and production decisions in a disrupted market. The upside is substantial. The downside on de-escalation is equally abrupt. Futures implementation carries additional roll costs in a heavily backwardated market.
The metals sleeve tells a different story. Copper fell 9.4% in less than a month. Inventories sit at their highest since 2003. The bull case for industrial metals requires a stabilising China and falling energy prices. As long as Hormuz remains closed, both conditions are under pressure.
The gold sleeve has the strongest simultaneous support: geopolitical uncertainty, stagflation risk, central bank demand, and a dollar caught between two forces. Gold is currently the most coherent position within the commodity basket.
The question for an allocator is not “commodities or not.” It is which sleeve, in what proportion, and with what exit scenario, because the three drivers are now moving in three different directions at once.
The map was wrong. The positions are real.
Those who were overweight on electrification and mining underinvestment are now also long a geopolitical supply shock. Those are two different positions sitting in one sleeve, and the map that got them here will not get them out. The energy sleeve no longer rewards patience, it rewards timing. The metals sleeve needs China, not Hormuz. Gold does what gold always does when everything grinds at once: it works.
On April 1, the new Asset Allocation Consensus is published. The numbers will shift. More interesting is where the arguments move, which allocators have already repriced Hormuz, and who is still working from the old map. The strait opened this story. The data will tell us how many saw it coming.
how many saw it coming.
New to this? The Strait of Hormuz carries one fifth of the world’s oil, and right now it is largely closed. That single fact is now the dominant force behind every commodity in your portfolio, more than China, more than the dollar.