



A technology allocation is a matryoshka doll. The investor thinks he is buying one doll, but whoever opens it finds a second one inside: America. And inside that, a third: the dollar.
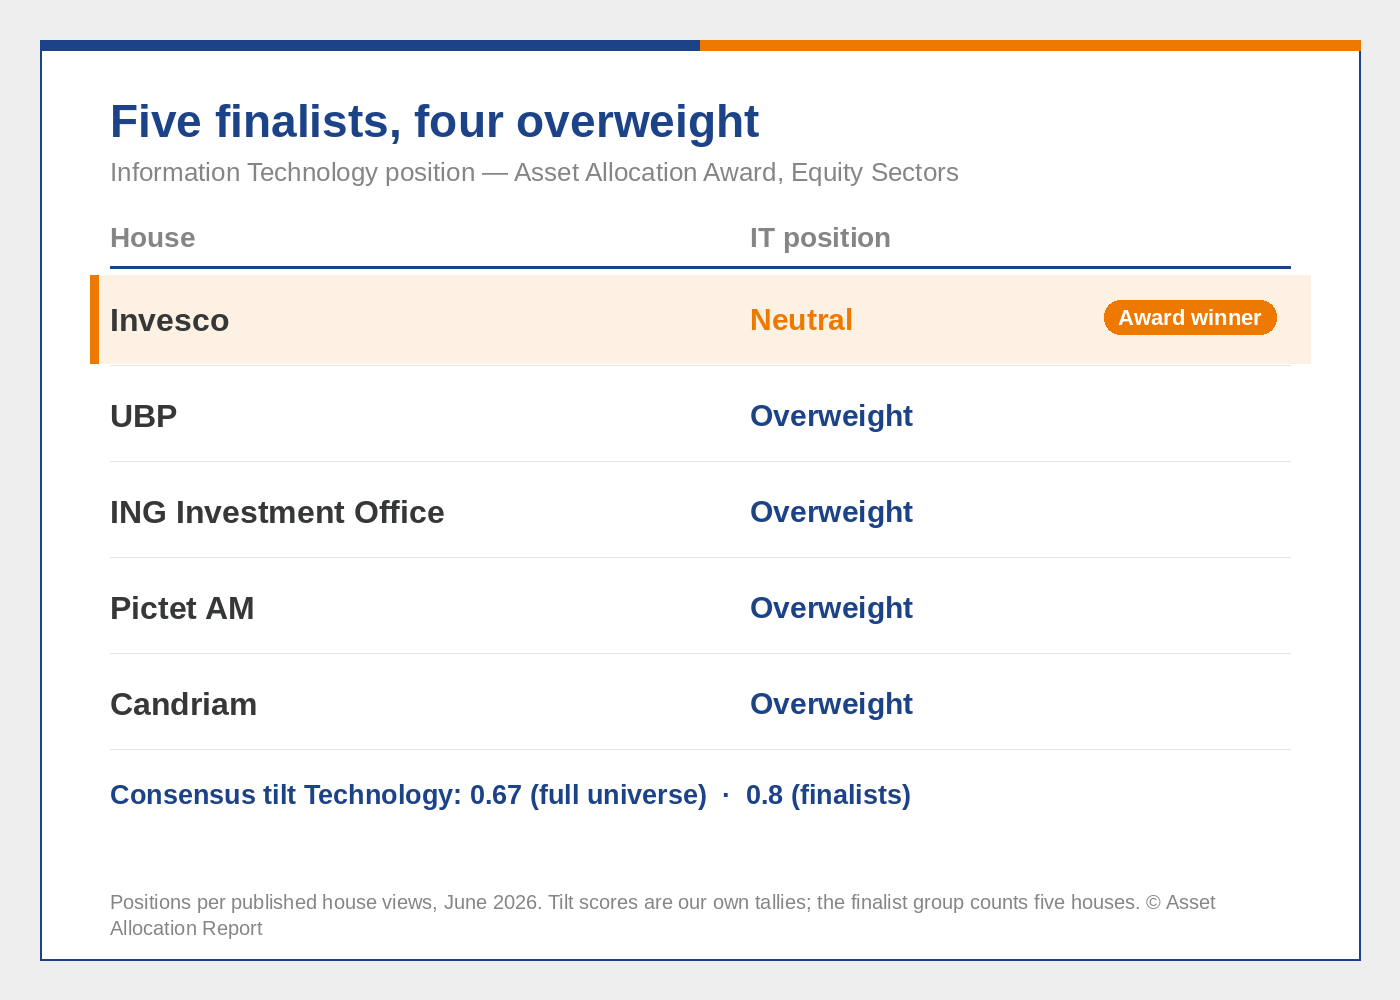
Technology is the most loved sector among asset allocators. Of the five finalists for the Asset Allocation Award for Equity Sectors, four are overweight. The only one staying neutral is, of all houses, the winner. That deserves an explanation, but first the question that precedes it: what exactly is inside that doll?
One sector, two hidden positions
The answer is in the holdings. The top 10 of the MSCI World Technology index accounts for 66.53% of the weight; for the Nasdaq 100 it is 44.71%. More striking: the two lists differ by just two names. That is more remarkable than it seems, because the Nasdaq 100 is not formally a technology index. It selects the hundred largest non-financial companies listed on the Nasdaq exchange, regardless of sector; Amazon and Alphabet officially fall outside technology. That a global sector index and an American exchange index nearly converge at the top says everything about how dominant the concentration is.
The regional breakdown makes it explicit. MSCI World Technology invests 89.47% in the United States, against 63.63% for the broad MSCI World. Overweight the sector, and you automatically increase your America weight. And for the non-US investor there is a third layer: an unhedged dollar position.
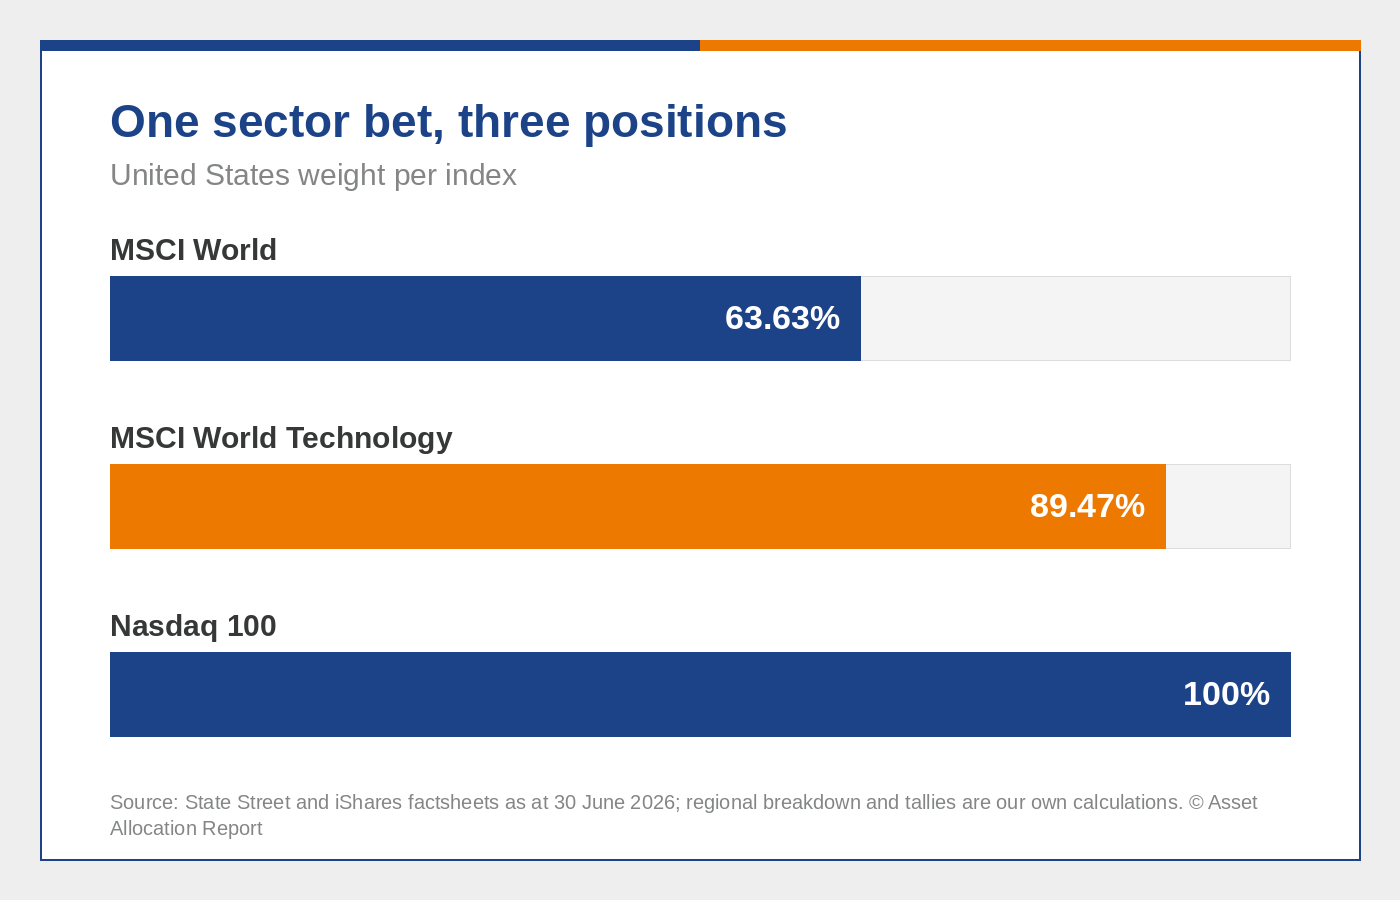
Here the sector allocation sends a signal that the regional and currency allocation must receive. Three decisions that most investment processes take separately turn out, in practice, to be one and the same position. The sector table hides a regional bet and a currency bet.
The consensus and its arguments
The consensus tilt for Technology stands at 0.67, the highest of all sectors in our universe. That tilt is based on the 68 asset manager house views we read this month. Among the five Award finalists, the tilt is even higher at 0.8. The specialists, in other words, are more positive than the broad field. Both figures are our own tallies; the finalist group counts five houses, which makes the second figure a qualitative signal, not a statistic.
The bull case rests on earnings, not on hope. Pictet AM reports that 99% of IT companies in the S&P 500 beat earnings expectations. UBP sees the sector’s 2026 earnings growth expectations more than doubling, from 31% to roughly 70%, and concludes that earnings are growing faster than share prices. Candriam points out that the forward price-to-earnings ratio of semiconductors is still in line with its five-year average.
The bear case, strikingly, uses the same sources. UBP notes that the SOX index trades at 28 times forward earnings, against a ten-year average of 19. ING Investment Office warns that elevated expectations leave no room for disappointments. Candriam took tactical profits in emerging markets because momentum has become crowded as a style factor. Four houses see the same risks; they just do not let those risks determine their allocation.
The dissenter is the winner
Invesco does. The Award winner is the only finalist neutral on technology, and the reason is not a sector view but a framework. In their scoring model, valuation carries three times the weight of any other factor. The US market trades at a cyclically adjusted price-to-earnings ratio of 47, just below the March 2000 peak of 49. When the US began its outperformance in 2008, that same measure stood at 25.
Then there is the AI question. In Uncommon Truths, Invesco‘s strategist asks whether AI is actually delivering for its users: the evidence for the makers of the infrastructure is there, but the evidence of durable productivity and margin gains for users is missing. As long as it is, the model does not justify the premium.
That doubt hits the sector investor more directly than it appears. Look at the top 10 again: NVIDIA, Broadcom, Micron, AMD, ASML, Intel, Applied Materials, Lam Research, eight of the ten names form the AI infrastructure chain. Invest in AI through the sector, and you buy almost exclusively the supply side of the theme. The platforms that apply and monetise AI fall outside the sector definition, and the purest AI companies are not even listed yet. A technology allocation is therefore not an AI bet, but a bet on the picks and shovels, precisely the side where Invesco questions whether the profits will stick. Within their US portfolio, technology is in fact a favoured sector; the neutrality sits at index level, not in conviction.
The consistency runs deeper. Invesco expects dollar weakness, and whoever follows the arithmetic above sees why that matters: a tech overweight is a dollar position. The winner does not dissent because a strategist holds an opinion, but because three separate model outcomes point the same way. Process over signal.
The position implication
If earnings growth continues: the consensus wins, and the hidden US and dollar exposure is rewarded rather than punished. If the AI gains for users fail to materialise: the Invesco framework wins, and the sector correction hits three positions at once. The hinge is not chip demand, but the first hard evidence of productivity gains outside the technology sector itself.
And so the circle closes: buy technology and you buy America, and buy America and you buy dollars. The matryoshka stands reassembled on the shelf, three dolls that look like one position. The consensus weighs the outer doll and finds it attractive; the winner takes them apart and weighs all three. Read the sector table as one decision, and you undercount your positions. Buying three dolls means weighing three times.
New to this? Buying the technology sector sounds like one decision, but it quietly ships with two more: a bet on America and, for non-US investors, a bet on the dollar. Knowing that changes how much technology you actually own.