

4 of 5 Years High Yield Outperformed, Why Tight Spreads Now Raise the Bar
US High Yield option adjusted spread (OAS) 295 basis points, 55 basis points below the 5 year average


This week’s tactical asset allocation question
Four of the past five calendar years, High Yield delivered the strongest returns within fixed income. It outperformed government bonds, investment grade, and emerging market debt.
The recurring objection was simple, spreads were too tight.
In practice, the higher coupon compensated for valuation risk. Carry dominated caution.
The question now is whether that regime persists, or whether late cycle dynamics erode the income advantage.
Consensus positioning
Within the Asset Allocation Consensus, positioning remains broadly neutral. As of 1 March, 25.4 percent of strategists are overweight High Yield, 45.8 percent neutral, and 28.8 percent underweight.
The net positioning score, defined as overweight minus underweight, moved only marginally from -0.017 on 1 February to -0.034 on 1 March. In other words, the debate has intensified, but positioning has barely changed.
Within fixed income preferences, Emerging Market Debt (EMD) ranks as the most attractive segment, followed by Inflation Linked Bonds. High Yield shares third place with Corporate Bonds, while Government Bonds remain the least attractive.
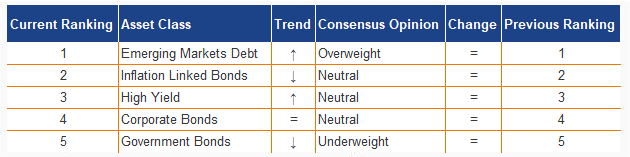
Fixed income attractiveness ranking based on Asset Allocation Consensus
This distribution reflects the same tension visible in the data: attractive carry, but limited valuation buffer.
One regime, two outcomes: Carry dominates, until growth turns
In a resilient growth regime, attractive all in yields and contained defaults allow carry to compound. Spread compression is not required for acceptable returns.
In a late cycle regime, tight spreads offer limited protection. Rising real yields lift refinancing costs. Earnings cyclicality becomes the binding constraint.
The regime call, growth stability versus deceleration, determines whether High Yield behaves as income or equity beta.
At a glance
• US High Yield OAS 295 basis points, well below historical average
• Euro High Yield OAS estimated 310 to 340 basis points, also compressed
• US Purchasing Managers Index (PMI) expansion, but cooling momentum
• Eurozone PMI improving, led by Germany
• US default rate 3.7 to 4.8 percent, forecast 3.8 percent with wide uncertainty band
March 2026 Positioning Snapshot
1. Spreads
US ICE BofA High Yield OAS stands near 295 basis points. The 5 year average is around 350 basis points. The current level sits roughly 55 basis points below average and near the 300 basis point threshold widely viewed as very tight.
Euro High Yield spreads are estimated between 310 and 340 basis points, versus a 10 year average near 400 to 430 basis points. Valuations are compressed across both regions.
At these levels, the buffer against macro disappointment is thin.
2. Growth signal
US Institute for Supply Management (ISM) Manufacturing PMI rose to 52.6 in January, then eased to 51.2 in February. Services PMI declined to 52.3. Expansion continues, but momentum softens and tariff related pull forward may distort the signal.
Eurozone composite PMI reached 51.9, with manufacturing at 50.8. Germany returned to expansion. France remains marginally below 50.
No region signals contraction. The US shows cooling momentum, Europe shows tentative recovery.
3. Default structure
The trailing 12 month US High Yield bond default rate stands near 3.7 percent, versus a longer term average around 3.4 percent. Leveraged loan defaults remain higher near 5.9 percent. Moody’s baseline forecast projects speculative grade defaults near 3.8 percent by end 2026, with a wide range between 1.7 and 8.3 percent.
By rating bucket, BB defaults remain near 1 to 2 percent, B near 3 to 4 percent, and CCC materially higher. Stress concentrates in the weakest cohort, not the index core.
Defaults are elevated but not accelerating.
The key takeaway for allocators
Spreads are tight. Growth has not broken. Defaults are contained but uncertain.
That mix argues for discipline, not expansion.
High Yield
3 Supports, Why Carry Still Anchors Returns
All in yields remain attractive relative to recent history. Even without further spread tightening, yield to worst can support mid single digit total returns over a 6 to 18 month horizon.
Default rates remain near historical averages. Broad credit stress is absent.
Balance sheets improved during the refinancing window of prior years. Near term maturity walls remain manageable.
In a stable growth regime, time supports returns.
4 Constraints, Why Tight Spreads Limit Margin
High Yield OAS trades well below medium term averages. That leaves little cushion against volatility.
A sustained PMI decline below 50 would pressure leveraged issuers. Growth deceleration transmits quickly through earnings.
Higher real yields increase refinancing costs and tighten financial conditions.
The weakest rating bucket already shows stress. A broader spread would reprice quickly.
Carry versus Recession Risk
2 Conditions for the Bull Case, Why Income Dominates
If PMI stabilizes above 50 and real yields plateau, carry remains the primary driver of return. Default rates near baseline projections allow spreads to remain compressed without repricing.
Under that regime, High Yield functions as an income anchor.
3 Triggers for the Bear Case, Why the Cycle Overrides Yield
If PMI rolls below 50 and default rates trend higher, spreads must widen. At 295 basis points, repricing potential is asymmetric.
The critical interaction is rising defaults alongside tight spreads. That combination historically precedes abrupt spread widening.
Under that scenario, High Yield behaves like equity risk.
Allocation Stance: Neutral
Spreads near 295 basis points do not justify an overweight. Growth does not justify an underweight.
Carry compensates for current risk, but does not warrant risk expansion.
Position Neutral until spreads widen meaningfully or growth momentum reaccelerates.
Debate this in the comments
A → Carry still compensates
At 295 basis points, US High Yield still offers mid single digit return potential if defaults stabilize near 3.5 to 4 percent. PMI remains above 50. Stress is concentrated in the CCC bucket.
Under that scenario, carry offsets tight spreads. A modest overweight remains defensible.
B → Asymmetry dominates
295 basis points sits 55 basis points below the 5 year average. The margin for error is thin. If PMI weakens or defaults migrate from CCC into B, repricing will not be gradual.
Downside resembles equity risk. Upside remains limited by compressed spreads. Neutral may already assume too much stability.
The decisive question
Is 295 basis points adequate compensation for late cycle uncertainty, or does it only work if growth remains intact?
What indicator would make you move from Neutral to Overweight or Underweight?